• Skip to primary navigation
  • Skip to main content
Danny Brown

Danny Brown

podcaster - author - creator

  • About
  • Podcasts
  • Journal

insights

Why Social Media Speakers Need to Do Better By Their Audience

Social media speakers

One of the things you can always guarantee whenever a social media conference comes around is all the tweetable soundbites that ensue.

From mind-blowing statistics to feel-good messages, there’s never any shortage of social updates or blog posts that share the best of the best from these conferences.

And, sometimes, you do actually get some great insights from these types of conference, and they deliver on the often-exuberant price for tickets.

And then there are the quotes and statistics that make you go, “Hmm, really?” so you decide to check it out.

The ensuing result is usually a little different from the buzzworthy?soundbite that’s being shared across the web.

You Wouldn’t Eat Out of Date Food, Would You?

A good example of this is the annual Social Media Marketing World shindig put on by Social Media Examiner. It gathers over 100+ (maybe even 200+) speakers for its event in San Diego.

The lead speakers are the usual suspects that speak at the event every year, and then you have the speakers for whom the event is an opportunity to reach a wider audience.

For me, it’s these “secondary” and “tertiary” tier of speakers that actually offer the value – but they’re usually not the ones getting the soundbite love. Which is a shame, since they’re not using out-of-date statistics that get widely shared.

From a post that shares “50 brilliant social media insights” from the conference,

JB tweet SMM

As a statistic, that’s pretty impressive and damning at the same time.

Impressive, as it’s clear social is increasingly the channel of customer satisfaction; damning, as that’s a pretty high number of people unhappy with brands.

Except… when you look into the data that statistic is from, it’s a two year old survey by Dutch survey agency TNS Nipo?(that link is to the Dutch original – you can use Google Translate or see an English snapshot here).

In any kind of research, two year old data can be out of date pretty fast. In terms of social media, two years is a lifetime.

[clickToTweet tweet=”In social media, data that’s two years old is a lifetime. #relevance #insights” quote=”In social media, data that’s two years old is a lifetime.”]

Add to the fact that the original study is about how companies in Holland are perceived, and using that stat for a North American event might be a little misplaced, given the cultural differences and use of social media between the continents.

It’s All Fun and Games Until You Need to Sleep!

It’s not always statistics about customers, and how brands need to shape up or ship out when it comes to social, that makes the tweetable rounds.

Sometimes, it can be inspirational quotes to make you feel like you can do anything.

MH tweet SMM

And it’s true. We do all get 168 hours per week. As my wife likes to say when quoting Empire Records, “there’s 24 usable hours in every day”.

Well, except when we want to sleep… though I get the point, as that can fall into the eight usable hours for sleep, or however many hours you need personally.

But to the “we all get 168 hours” quote. It stems from a book called 168 Hours: You Have More Time Than You Think, by Laura Vanderkam. In it, the author shares her insights about making better use of our time, as well as the thoughts of others who have identified how to make the most of the time we have.

As a call-to-action to live more fulfilling lives on our own schedule, it’s great. As a realistic option? Maybe not so much.

While the book offers some thoughtful early insights, as it progresses the author switches it up a little, and the advice boils down to if you want to do less time doing the mundane things like laundry, dishes, even just looking after your kids etc, then just hire someone. This will free up the time you need to relax and do more personal things.

Erm… okay. That works if you’re a successful author. A day-to-day person and parent? Not so much.

A Percentage of a Percentage of a Percentage Equals…

Perhaps the most shareable of statistics is the kind that shows an almost overwhelming, mind-boggling number that pushes you back in your chair and burns your eyeballs with the sheer volume of the statistic.

These are the ones that immediately have you pumping your fist and shouting, “Hell yeah, social media!”

Such a case would be when a percentage is almost as complete as you can be.

Pinterest percentage

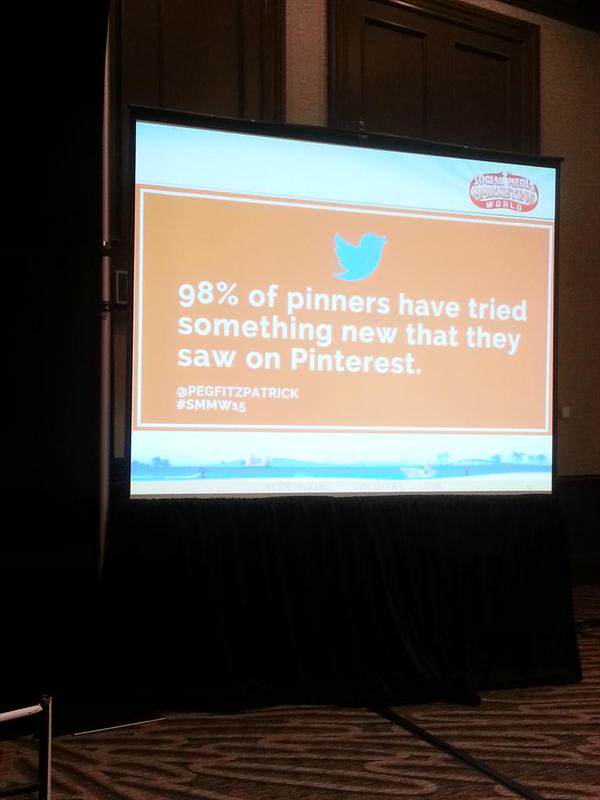
98% – I don’t care what your math expertise is, that’s an impressive number by anyone’s standards.?Especially when you take into account that Pinterest is sitting around the 50 million active users mark in the US.

So, of course, it’d be great to get a little more background to this stat.

The figure used in the slide from the image above is taken from the Pinterest Media Consumption Study created by US agency Ahalogy, whose goal is to make marketing on Pinterest easy for brands and content creators.

When you look at their study in depth, they describe their methodology.

The?Ahalogy 2014 Pinterest Media Consumption Study?surveyed?1,300 males and females ages 15+ across the United States?between February 26 and March 11, 2014. Of the 1,300 people?surveyed, 500 were active Pinterest users, meaning that they?use Pinterest at least once a month.

1,300 isn’t a bad number to offer a representation of the public for a survey, though maybe a small ratio for something with millions of users like Pinterest.

Of that 1,300, only 500 were active Pinterest users. 500. Which is just less than 38.5%. So, to the image from the Social Media Marketing World talk, it’s more like 98% of 38.5% try something new – a little less impressive (though still not a number to sneeze at).

[clickToTweet tweet=”We need to all be better, and push for the data beyond the insights. #data #marketing” quote=”We need to all be better, and push for the data beyond the insights.”]

But when you’re talking about 500 users as an indicative number, versus almost 40% of 45 million users, and that is then used as a statistic at a conference where it’s re-shared as an important statistic…. you can see where I’m going with this.

A percentage of a percentage of a percentage isn’t all that much of a percentage after all.

Quotes Are Great, But Insights Are Better

While sharing statistics and numbers makes for great soundbites, the data needs to be current and addressed (in all fairness, it may be that both Jay and Peg advised the audience of the background behind the tweets shared in this post).

If an audience is looking to take away knowledge from a speaker’s session, or an event, or a panel, etc., going away with two year old data, or numbers that don’t tell the whole story, isn’t going to cut it.

The insights given by an event’s speakers relate to the data they share. If the data isn’t relevant to today’s market, the insights lose a bit of weight, and tie into the whole eleventy billion mindset.

We need to all be better, and push for the data beyond the insights. It’s how we learn as people and grow as businesses. Big can be great; focused is usually much more effective.

Something to keep in mind, both as a speaker and an attendee, the next time you’re about to share a quotable statistic.

The Assumption of Dumbing Down the Message

Who cares

The Starsville Saga by Jaclyn Aurore

This is a guest post from my wife Jacki. She’s the author of Starting Over and Standing Up, the first two books in the Starsville Saga. A version of this post originally appeared on her blog, but I wanted to share it here as I feel the question of definition, and the assumptions we make when it comes to dumbing down our own messages, transfer well to business and marketing in general, as well as our own blog communities.

Starting Over and Standing Up, the first two books in the Starsville Saga,?are currently listed in the Young Adult (YA) genre.

As the saga progresses, the characters get older and deal with more mature things. The last book in the saga?will be in the adult genre, meant for ages 18+.

I?m not sure how the audience will react to that, but I wrote my characters the way I thought I should.

They go from junior high, to high school, to university and adulthood. I hope my audience will grow with them.

I?ve been told that Starting Over and Standing Up should be in mixed genres for the following reasons:

  1. The main character is a child.
  2. The characters have dark back stories that are too deep for young adults to understand.

I tend to disagree with both of these things.

First, the main character starts telling her story at the age of 13, but the books take place over the course of four years. Second, I believe that there is nothing too deep for the YA audience to understand. Sadly, too many people can relate to these dark issues.

YA is one of the genres I like to read for its simplicity. It doesn?t take the author 300 pages to describe the sunset. The sunset is what it is, and for that I?m happy. In general though, I find there are three types of YA authors:

  1. The authors that dumb down content for their YA readers.
  2. The authors that dumb down vocabulary for their YA readers.
  3. The good authors.

Maybe Starting Over and Standing Up deal with some darker issues, but I?m not going to dumb it down. I?m also not going to write condescendingly.

I write the way I speak. So whether you are 14 years old or 40 years old, my language will remain consistent. Minus the profanity.

I hope that’s okay with you.

Young adult fiction writer Jaclyn AuroreAbout the author: Jaclyn Aurore is the author of young adult fiction?books?The Starsville Saga:?Starting Over,?Standing Up,?Giving In,?Hanging On,?Leaving Behind, and the stand alone fantasy,?My Life Without Me.?Her books have been described as ?Wonderfully human?, ?Evokes the awkwardness of teenage life perfectly?, ?Heart-wrenching and heartwarming at the same time?, ?Twilight without the vampires?, and ?Nothing at all like Twilight?. You can read more from Jaclyn on her official website.

We Need Better Insights, Not More Data

A little while back, I wrote about the difference between analytics and insights. My key point was while we may have awesome data at our fingertips, not knowing what to do with that data renders it obsolete and ineffective.

A new survey, with responses from attendees of the recent DMA2012 conference, as well as the recent Forrester Research conference Seizing Opportunity From Digital Disruption, seems to back up that insights versus analytics post.

Filtering The Noise Chamber

Today’s connected consumer has access to an insane amount of information, all at their fingertips, thanks to the ubiquity of smartphone access to the web.

From checking restaurant reviews and stock prices, to taking pictures of a new pair of jeans and asking the opinion of friends on Facebook, today’s consumer is no longer restricted to choosing a brand through a push marketing approach.

This change of direction in the purchase cycle has resulted in brands playing catch up in trying to make sense of this new paradigm.

Instead of buying a media spend and determining results based on increased foot traffic to a storefront, marketers and analysts now have to understand what tipped a consumer from intent to buy to an actual purchase, and what external factors can impact that decision in the first place.

To enable this, technologies and companies have sprung up to allow marketers all the data they need, and more. However, this now presents a new and far more dangerous problem, from the perspective of the marketer:

How can the right data be filtered when there is so much of it? Failure to extrapolate the right data will only make the job tougher for any brand looking to truly understand their customer’s mindset.

Failure to understand your customer equals failure to grow and remain afloat. The scary thing is, though, it’s clear that many marketers just aren’t getting to grips with this new analytical methodology, as the report shows.

The Problem with Data – Lack of Insight

Some of the key findings from the attendees include:

  • 45% said the analysis and application of data is the biggest challenge;
  • 39% are not using demographic information or customer behaviour patterns when creating marketing strategies;
  • 44% don’t envision hiring new employees to oversee this data;
  • 83% plan to start considering using real-time data.

There are other worrying statistics from the results, but I picked out these four because they highlight perfectly the challenges to today’s marketer, as well as the failings of many businesses looking to operate in the space.

If more than a third don’t take something as basic and yet hugely important like demographics and customer behaviour into the equation, and almost half think they’re qualified to oversee this core business component themselves, that’s a problem.

Even more disconcerting is the percentage that don’t use real-time data – 83%.

Eighty three percent.

That’s more than three quarters of the businesses asked not utilizing something as simple as Twitter Search to get the lowdown on what’s being said about their brand or product at any given time, and being able to react to it.

It’s almost like we’re trapped in 2006. If businesses today aren’t utilizing the technology out there to make their business smarter and more effective, then it’s no wonder so many fail when it comes to using social as a complementary component to their other marketing efforts.

It’s not data that’s the problem – it’s the lack of insight into how that data can be mined, analyzed and acted upon. And there’s no need for this to be the case.

Smarter Thinking, Better Execution

Just looking at some of the key points I pulled from the report, there are simple solutions to every one of them.

If analysis and application are the biggest challenges, identify the people who understand this new research opportunity to provide the analysis that’s most important to you – lead generation results, customer service satisfaction, brand perception, competitor activity, etc. (This also addresses the 44% of businesses who don’t foresee employing people to oversee the data).

Additionally, identify the analysis that’s most important to you – lead generation results, customer service satisfaction, brand perception, competitor activity, etc. If you have no-one internally that can address this need, look to the kind of people your competitors have in this key role and act accordingly to, at the very least, match that investment.

Use technology like Quantcast to identify the demographics and behaviour of your web traffic. Cross measure this with tools like Traackr and Nimble, that can identify the key people talking about your brand and then filter them into groups and level of relevance and/or importance when it comes to contact.

Change the mindset of considering real-time intelligence and start making it a key part of your brand’s customer experience reporting. Hell, you don’t even have to be on a platform to set up alerts on the information that matters, and then allocating the right person to deal with that opportunity/situation.

Unless, of course, you’re the type of business that would have the chance to speak with your customer in your shop about how their visit was, and instead advise them you’d rather be in the office drinking coffee and playing Angry Birds.

Data doesn’t have to be scary – you don’t need to be mining every single piece of information out there about your brand. You do, however, need to be mining for the right data that’s important to you at that given time, and act on that.

Reduce the data. Increase the insights. Be a smarter business. You owe it to yourself, and your customers deserve better.

You can get a free copy of the full report here.

Data rich and insight poor

Analytics Are Not the Same as Insights

Teens and Technology

Take a look around the web – especially on social networks – and you’ll see a lot of people and brands complaining about their marketing results.

From complaining about lack of action on a blog or website to little return on Facebook or LinkedIn, there’s a whole swathe of people blaming the lack of success on anything and everything.

“But have you looked at why you’re failing?” you can ask, and you’ll get the response, “Yes – we have analytics installed and we know we’re not getting the reach and results we’re looking for.”

And, usually, that’s the crux of the problem right there – because people are confusing analytics with the solutions to their problem, when it’s more than that that’s needed.

Analytics Are Not the Same as Insights

Don’t get me wrong – analytics are key and if you’re not even tracking the most basic of details around what you’re doing, of course you’re going to be screwed. Even the most basic of analytics gives you:

  • Traffic (in and out)
  • Demographics
  • What content works
  • What platform drives traffic
  • Behaviour on site

Go more advanced, and you can get a heck of a lot of information about your customers, existing and potential.

You can see what time of day they like to be online, what type of browser they use (desktop, mobile, Apple, PC, etc), what type of call-to-action’s catch their eye and turn them from intent to purchasers, and much more.

If you run a business, or are looking to run an online campaign for your business, and you’re not using analytics before, during and after to guide your decisions and follow-ups, then you’re not being anywhere near effective enough to be successful.

But… as good as these analytics are, they’re only part of the equation – the bigger picture comes from what insights you glean from them, and what you do with these insights.

Insights Are More Than Just Good Ideas

Once you have the information you need from whatever analytics package you use, the real work can begin. As an example, let’s say you’re looking to launch a book – here’s some of the ways to use insights from analytics for your campaign to reach your audience.

1. The percentage of tablet and mobile browsing versus desktop

From a personal point of view, I love to have an actual book in my hand when it comes to reading – there’s just something real about being able to flip a page versus sliding your finger across a screen. But that’s just me – many of my friends are far more attuned to tablet and eReader options.

By looking at your ideal audience – age, sex, income, browsing habits, etc – you can identify what their persona is more likely to be, and that can help define what the lead platform is – full print version or digital, with print to follow. You can also see which platform is best to lead on from an eReader point of view – Kindle, Nook, Kobo or other.

This gives you a better chance of being picked up by your audience out the gate.

2. Are they active socially?

Despite what people like me might think, social media is still not truly mainstream for the majority of the world. Sure, Facebook might claim one billion members, but that’s nowhere near the active users. Same with Google+, Twitter, etc. But that doesn’t mean you can’t use these channels to market.

Before you begin your campaign, carry out an online audit and find out where your audience like to hang out and, more importantly, when. It’s no good jumping on Facebook at 3.00pm in the afternoon when your audience is mostly online between 9.00am and 10.30am in the morning.

Get to know which platforms they prefer, how they prefer to use them (for friends, via mobile, as a curation tool only, etc) and start to document what the optimum time of day is for you to be online. Couple that with the platform and tailor your message accordingly.

Find groups and chats on Twitter to participate in – while dedicated to Canadian books, #CanLitChat is a good example of what’s on Twitter for authors and readers to participate in.

If a lot of your audience likes watching videos on YouTube, ask yourself if there’s an opportunity to set up a reading channel. Take excerpts of your book, read it, and ask for video feedback, with other YouTube users tagging your video. Better still, run a contest for other users to read the excerpt, and the best gets all your books free for life.

Additionally, start a reading group on Google+ and use Hangouts to pick apart your initial drafts, and allow early glimpses into what people can expect. Having your audience invested in this way encourages them to support you when you do launch.

3. How to play to your demographics

Every product or service usually has a core audience. Yes, there are examples where age and sex don’t come into it and a product crosses generations – Apple products, for instance, and Thomas the Tank Engine (you know it’s true!). For the most part, though, the majority of promotions need to be geared to a certain demographic.

Using your analytics and understanding who your audience is shapes the strategy behind your outreach.

Social network age demographics

As you can see from the chart above, published earlier this year by Pingdom.com, there are very different demographics depending on what platform you’re on – or your audience is.

Let’s say you’re going after the 35-44 age group. You might think that you should start on Facebook because, well, that’s where the whole world is, right? Not so fast, Skippy.

What about LinkedIn? That’s almost twice as much as Facebook for that particular demographic – can you take advantage of groups or ads on there? How about Yelp – can you work with local bookstores that obviously care about their audience and do personal readings?

Bigger yet, take a look at Slashdot and Quora – while they may not be the first that come to mind, you can see they’re hugely popular with your audience. Find out why – in these cases, it’s the question and answer format that attracts.

Start to build a presence there, answer questions, ask your own, build your reputation, and then begin to ask questions around your book topic. You’ve built trust, gained an audience, and approached it properly when it comes to that platform – again, making your book (or service) more attractive and warmer to the touch of that audience and their pockets.

Data is Everything and Everything is Data

As you might guess, I’m a huge data nerd – because I love understanding what makes people tick. What gets their attention – how is that attention kept? What turns them from a curious bystander to a purchaser or advocate?

Data can tell you all this and more – the trick is in knowing what to do with the data once you have it. Get that right, and you’re at an immediate advantage over your competitors.

And that’s never a bad thing, right?

© 2026 Danny Brown - Made with ♥ on Genesis