

This is a guest post from Dan Norris of Informly.
Recently I launched a new feature inside my simple stats dashboard Informly that helps content marketers measure how effective their content is.
I’ve been creating a lot of content leading up to the launch of Informly last week and one thing I’ve wanted to measure is which bits of content are hitting the mark.
Everyone knows that good posts attract visits, comments and social shares (likes, tweets etc) but there isn’t really an easy way to specifically measure this as a whole.
This is where our ‘Post Impact’ chart comes in.

What is Post Impact?
Post Impact gives you one overall measure of the impact of a blog post by adding up data from the following sources:
- Facebook (total likes & shares)
- Twitter (total tweets)
- Google+ (Total +1s)
- Disqus (total comments)
- Google Analytics (visits to the post)
You can use as many of these services as you like to build your own version of what ‘Impact’ means to you. Or you can build a few charts using different measures for each.
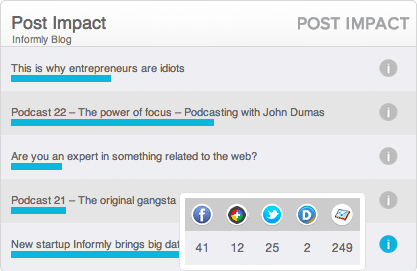
Post Impact Specifics
In addition to the overall chart you can also mouse over the (I) icon to get the specific numbers from each post ? i.e.
- The total likes and comments on Facebook
- The total tweets
- The total +1’s and shares on Google+
- The total comments from Disqus
- The total visits to the post from Analytics
This is useful to compare specific numbers with other posts and also to get an idea of what might be driving the success of a post.
Trends
Our annual chart shows your last 10 posts so you can use it once again to work out which ones were hitting the mark and which ones weren’t but also to see how it’s trending over time. My chart for Informly is below.

The big spike in the middle was from when we launched but overall you can see the trend is generally going up.
So What’s the Point?
Looking at stats go up is fun but what you want to be doing is looking for something actionable. In the case of Post Impact, the point is working out which piece of content worked well and which didn’t. In my case above I can see that a good podcast episode tends to have high impact so doing more of these is critical for me.
The other thing that stands out to me is the infographic I did when we launched also had a big impact (it’s the bar to the right of the big one in the middle). It got less shares than our launch but more traffic to the site so I’ll definitely be doing more infographics!
What do you think?
What do you use to measure your content marketing? I’d love to know how to improve the Post Impact chart to make it an even more awesome measure of content marketing effectiveness.
 About the author: Dan Norris is the founder of Informly, a tool that enables small business owners to view a simple one page report of stats from their favorite cloud services. Informly talks to popular services like Google Analytics, PayPal, Xero, Mail Chimp etc and presents the most important information in a format that any business can understand in seconds. Dan is on Twitter, Google+ & Facebook (a little bit too often according to Rescue Time).